Data
analysis sheet for step height
measurements from one step
height test structure for use
with the MEMS 5-in-1 RMs
a) b)
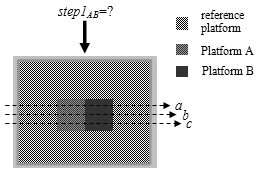
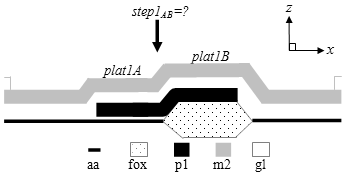
Figure SH.1.a.1.For a CMOS step height test
structure: a) a design rendition and
b) a cross-section.
To obtain the
following measurements, consult SEMI
standard test method MS2 entitled
"Test Method for Step Height
Measurements of Thin Films."
date (optional) =
/
/
comments
(optional) =
Table 1 - Preliminary
INPUTS
Data Set Prelims
Description
1
temp
°C
temperature during
measurement (should be
held constant)
2
relative
humidity
%
relative humidity during
measurement (if not
known, enter -1)
3
proc
which process?
4
which
For CMOS RM chips,
which of the six step
height measurements? For
MUMPs chips, which quad?
5
which2
For CMOS chips, which
iteration of the test
structure where "first"
corresponds to the
topmost test structure
in the column?
6
orient
orientation of the test
structure on the test
chip
7
×
magnification
8
align
alignment ensured?
9
level
data leveled?
10
μm
certified value of
physical step height
standard used for calibration
11
μm
certified one sigma
uncertainty of the
certified physical step
height standard used for
calibration
12
μm
maximum of two uncalibrated
values (σbefore
and
σafter)
where
σbefore
is the standard
deviation of six
measurements
taken across the
physical step height
standard before the data
session and
σafter
is the standard
deviation of six
measurements taken
across the physical step
height standard after
the data session
13
μm
uncalibrated average
of the six calibration
measurements used to
calculate
σ6ave
14
σ
μm
maximum of two uncalibrated
values (σsame1
and
σsame2)
where
σsame1
is the standard
deviation of six measurements
taken on the physical
step height standard at
the same location before
the data session and
σsame2
is the standard
deviation of six
measurements taken at
this same location after
the data session
15
μm
uncalibrated average
of the six calibration
measurements used to
calculate
σ6same
16
μm
uncalibrated drift in
the calibration data
(i.e., the uncalibrated
positive difference
between the average of
the six
measurements taken
before the data session
at the same location on
the physical step height
standard and the average of the
six
measurements taken after
the data session at this
same location)
17
the
z-calibration
factor (for the given
magnification)
18
%
if
applicable,
the maximum relative
deviation from linearity over the
instrument's total scan
range, as quoted by
the instrument
manufacturer (typically
less than 3 %)
19
srepeat(samp)
%
step height relative
repeatability standard
deviation obtained
from step height test
structures fabricated in
a process similar to
that used to fabricate
the sample
20
s
μm
uncalibrated surface
roughness of
platNX measured
as the smallest of all
the values obtained for
splatNXt.
(However, if the
surfaces of platNX,
platNY, and
platNr all have
identical compositions,
then it is measured as
the smallest of all the
values obtained for
splatNXt,
splatNYt,
and
splatNrDt
in which case
sroughNX=sroughNY.)
21
s
μm
uncalibrated surface
roughness of
platNY measured
as the smallest of all
the values obtained for
splatNYt.
(However, if the
surfaces of platNX,
platNY, and
platNr all have
identical compositions,
then it is measured as
the smallest of all the
values obtained for
splatNXt,
splatNYt,
and
splatNrDt
in which case
sroughNX=sroughNY.)
Nomenclature: N refers to the test
structure number (1,
2, 3,
etc.), X and Y refer
to the platform letter (A,B, C,
etc.),
r indicates a
reference platform,
D directionally
indicates which reference
platform, and t indicates which
data trace (a, b,
or c).
Note 4:
stepNXY = AVE(stepNXYa,
stepNXYb, stepNXYc)
Note 5:
uLstep =SQRT{[splatNXave2-
(calz
sroughNX)2]
+ [splatNYave2-
(calz
sroughNY)2]}
Note 6:
uWstep =
σstepNXY
=
STDEV(stepNXYa,
stepNXYb, stepNXYc)
Note 7:
ucert = |σcertstepNXY
/ cert| Note
8:
ucal = |σ6avestepNXY
/z6ave|
Note 9:
urepeat(shs)=
|σ6samestepNXY
/ z6same|
Note 10:
udrift = |(zdriftcalz) stepNXY
/ [2(1.732) cert]|
Note 11:
ulinear = |zlinstepNXY
/ (1.732)| Note 12:
urepeat(samp)
=srepeat(samp) |stepNXY|
Note 13:
ucSH =
SQRT(uLstep2+uWstep2+ucert2+ucal2+urepeat(shs)2+udrift2+ulinear2+urepeat(samp)2)
(Each of the standard
uncertainty components is
obtained using a Type B
analysis, .
except for uWstep, ucal, urepeat(shs),
and urepeat(samp)
which use a Type A analysis.)
USH = 2ucSH =
μm
(expanded
uncertainty) 3ucSH =
μm stepNXY
- USH
=
μm (a lower
bound for
stepNXY)
stepNXY
+ USH
=
μm (an upper bound for stepNXY)
Report the results as follows: If it is assumed that the
estimated values of the
uncertainty
components are
approximately Gaussianly distributed with
approximate combined standard
uncertainty
ucSH, the step
height is believed to lie in the
interval stepNXY
±
ucSH (expansion
factor k=1)
representing a level of
confidence of approximately 68 %.
Modify the input data,
given the information
supplied in any flagged
statement below, if
applicable, then
recalculate:
1.
2.
The value for temp
should be between
19.4
°C and 21.6
°C, inclusive.
3.
The
value for relative
humidity (if known) should be
between 0 %
and 60 %,
inclusive.
4.
5.
6.
7.
8.
9.
10.
11.
12.
13.
14.
15.
μm and less than or
equal to the smallest
measured value for
splatNXt
and
splatNYt,
respectively.
16.
17.
18.
19.
splatNYt
should be between 0.00
μm and 0.100 μm,
inclusive.